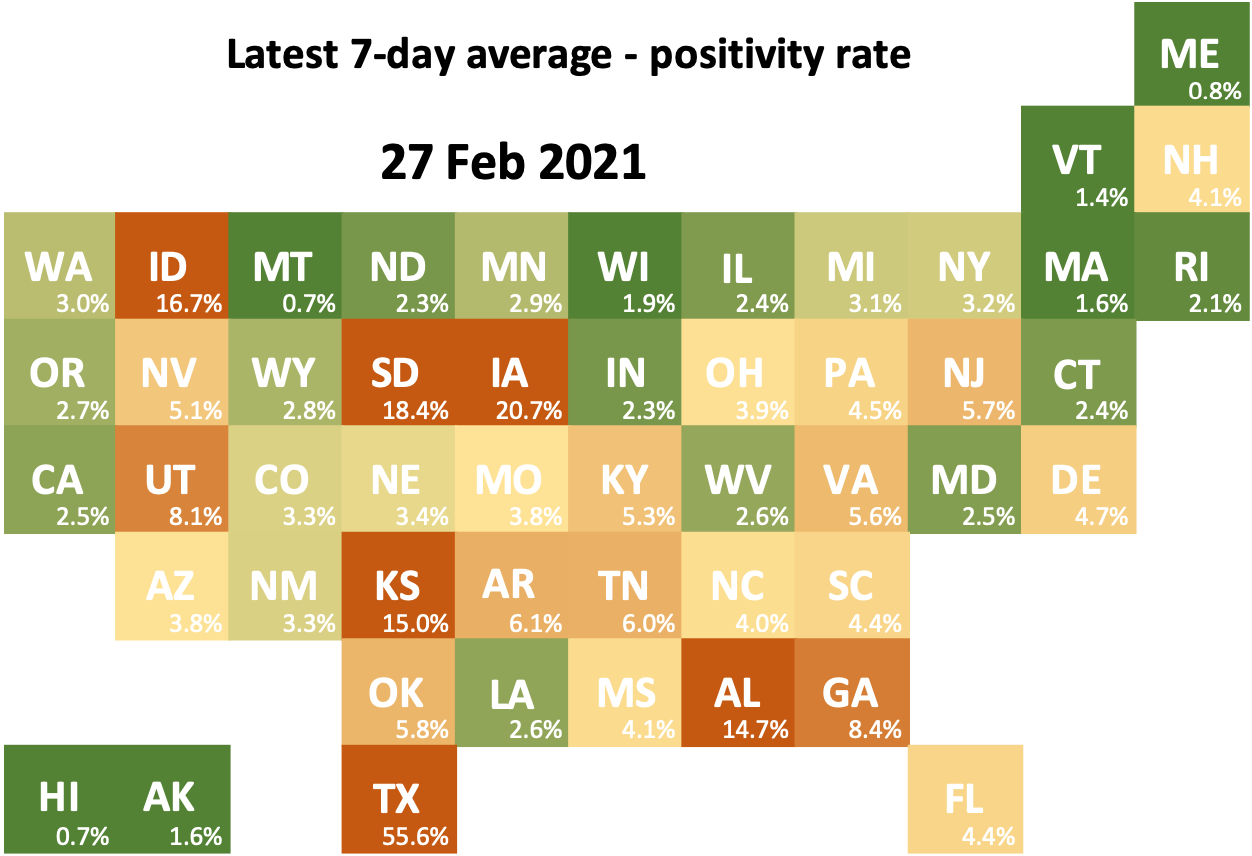
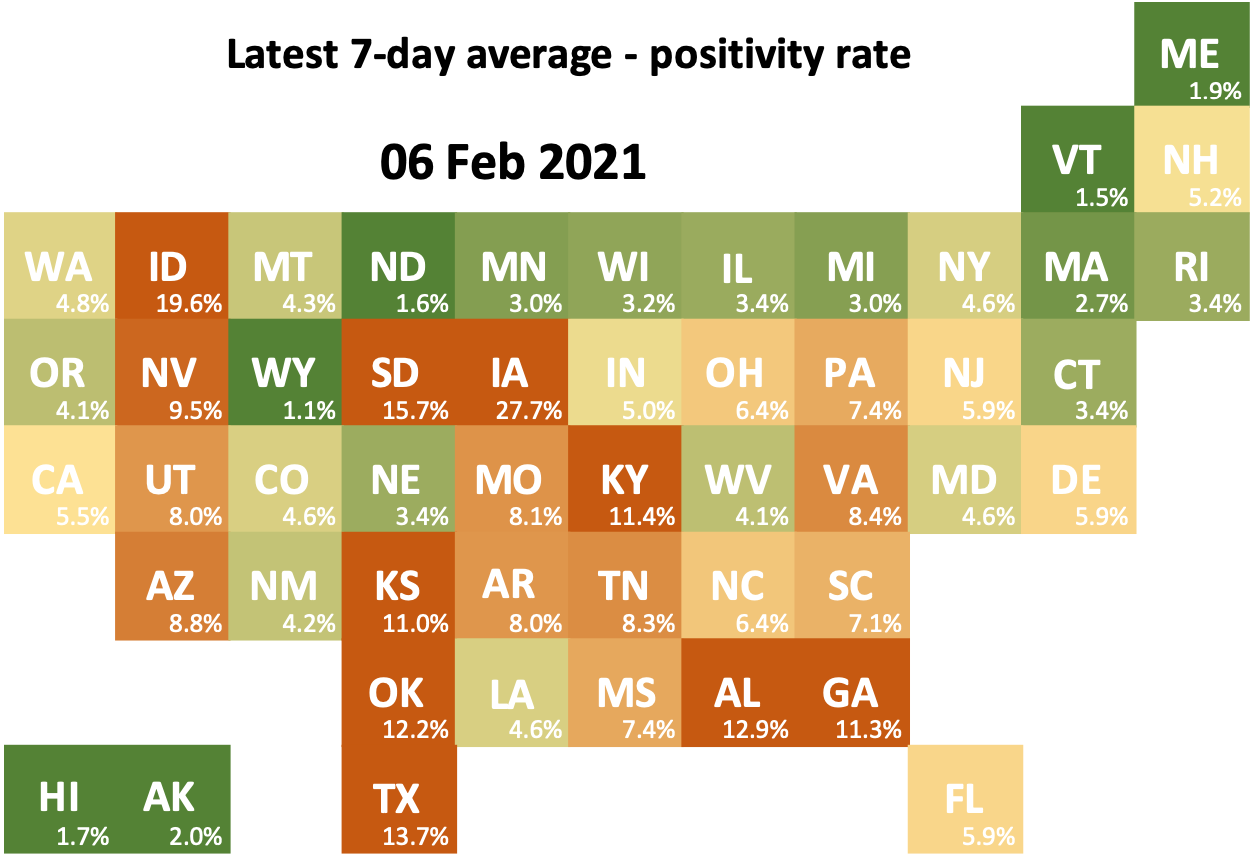
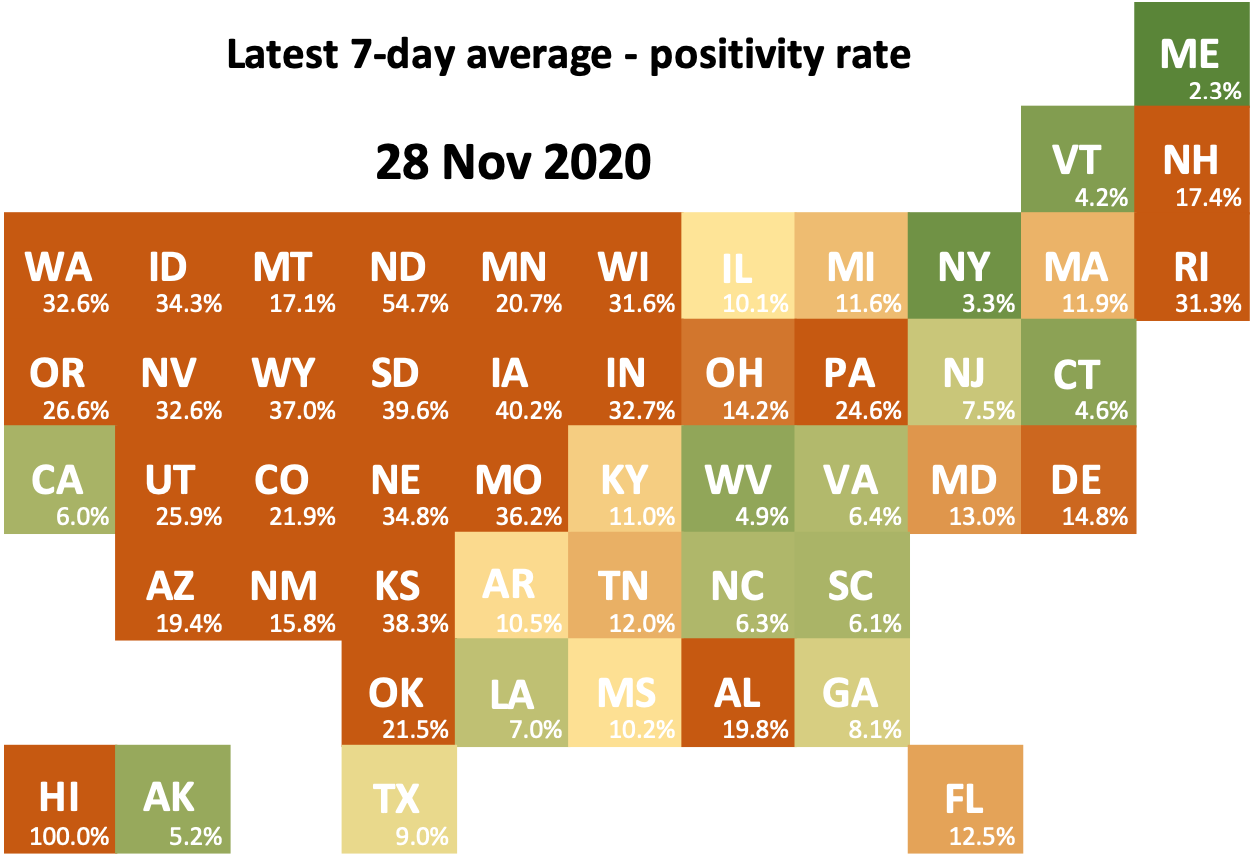
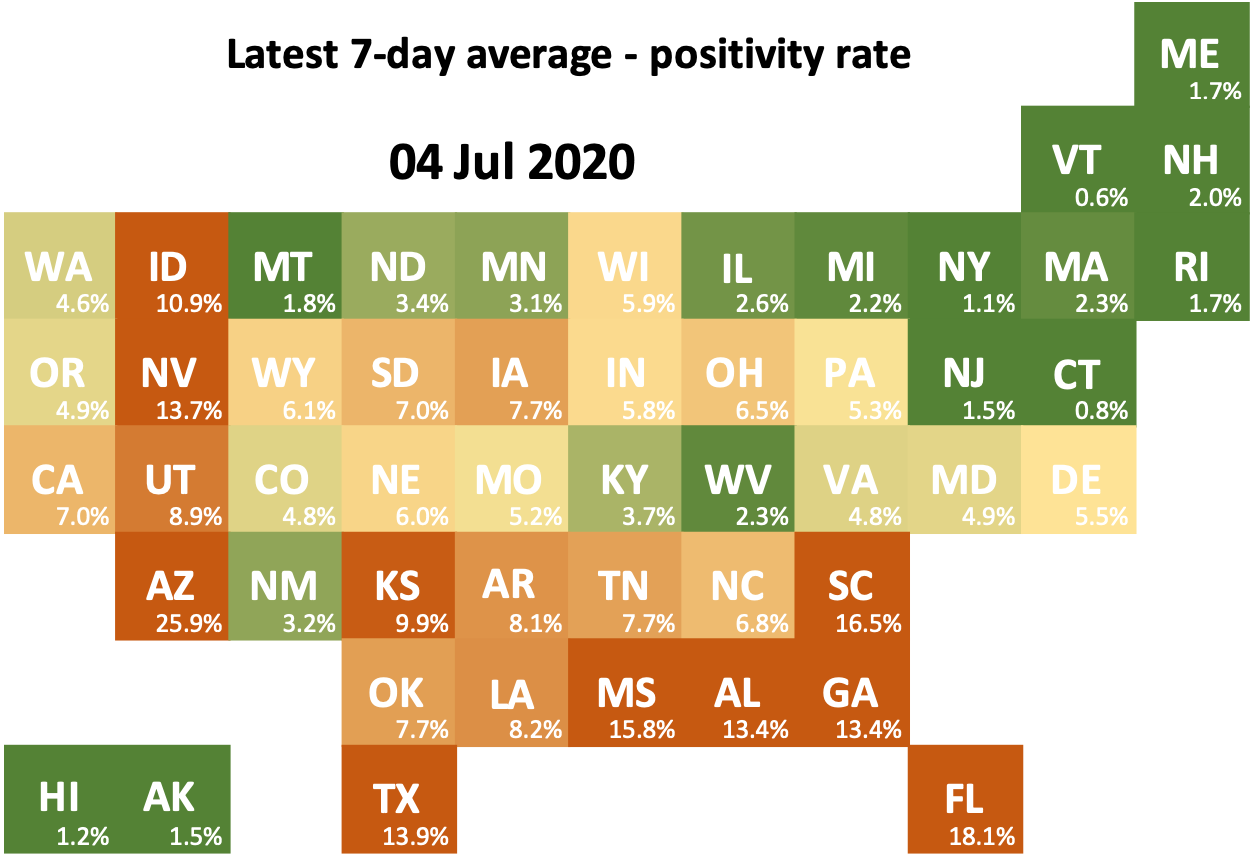
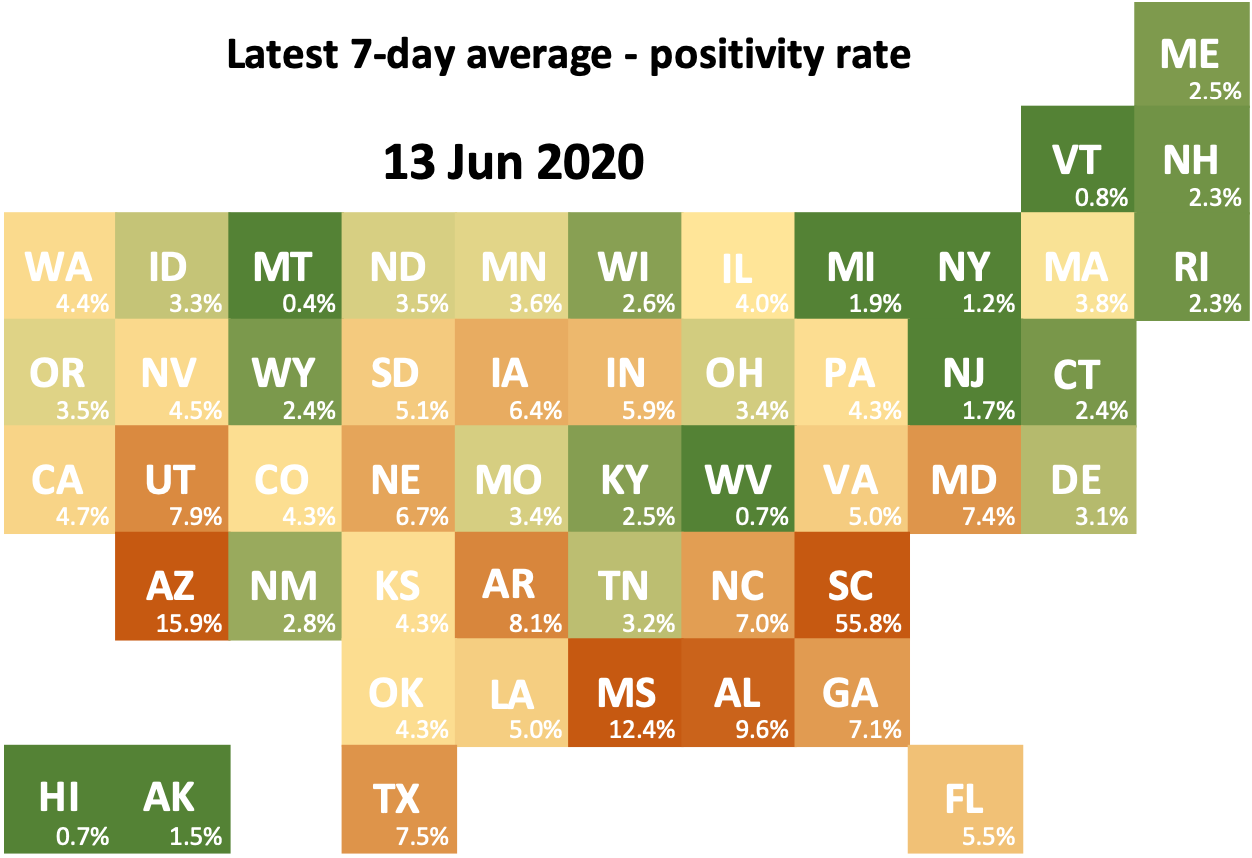
The basis for the positivity calculation shifted between these two weeks - numbers will look lower for most states. There were some shifts in the previous week for specific states (e.g. HI).
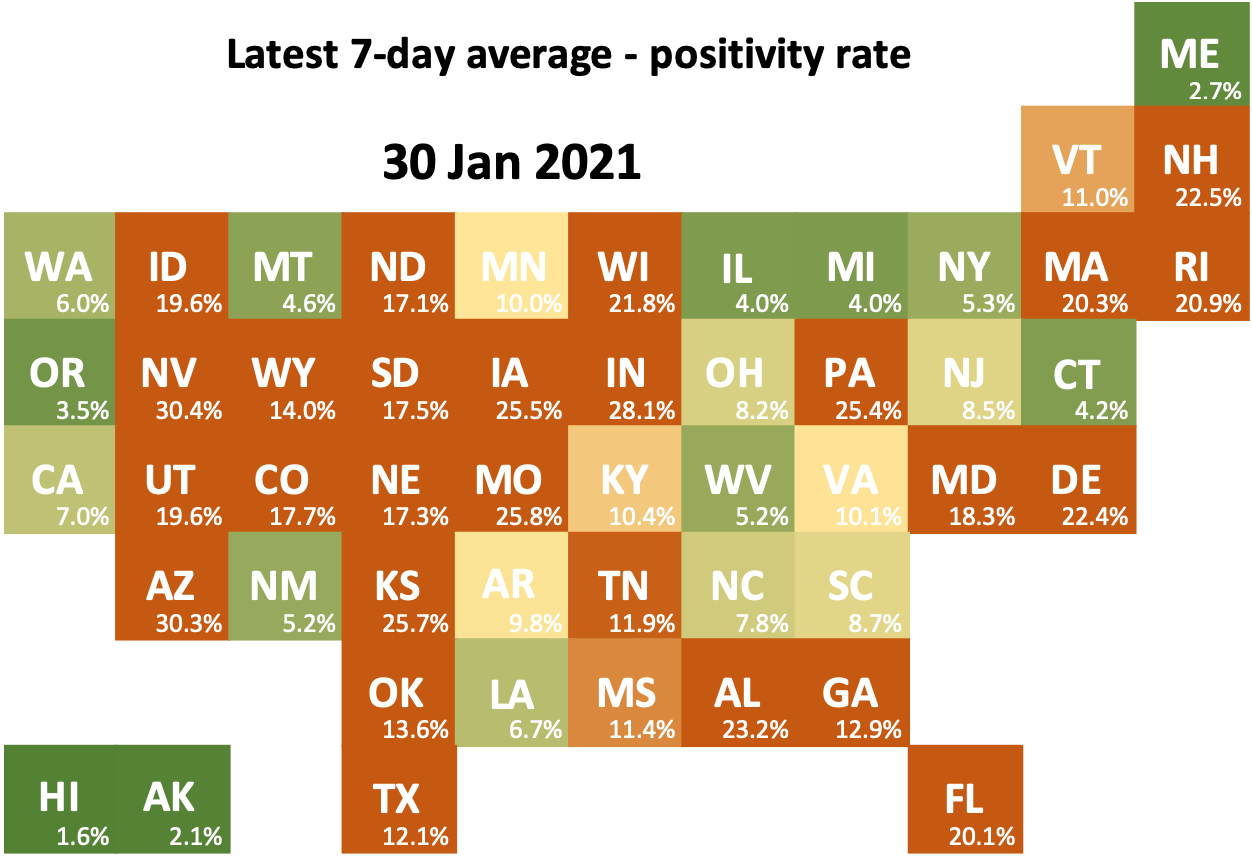
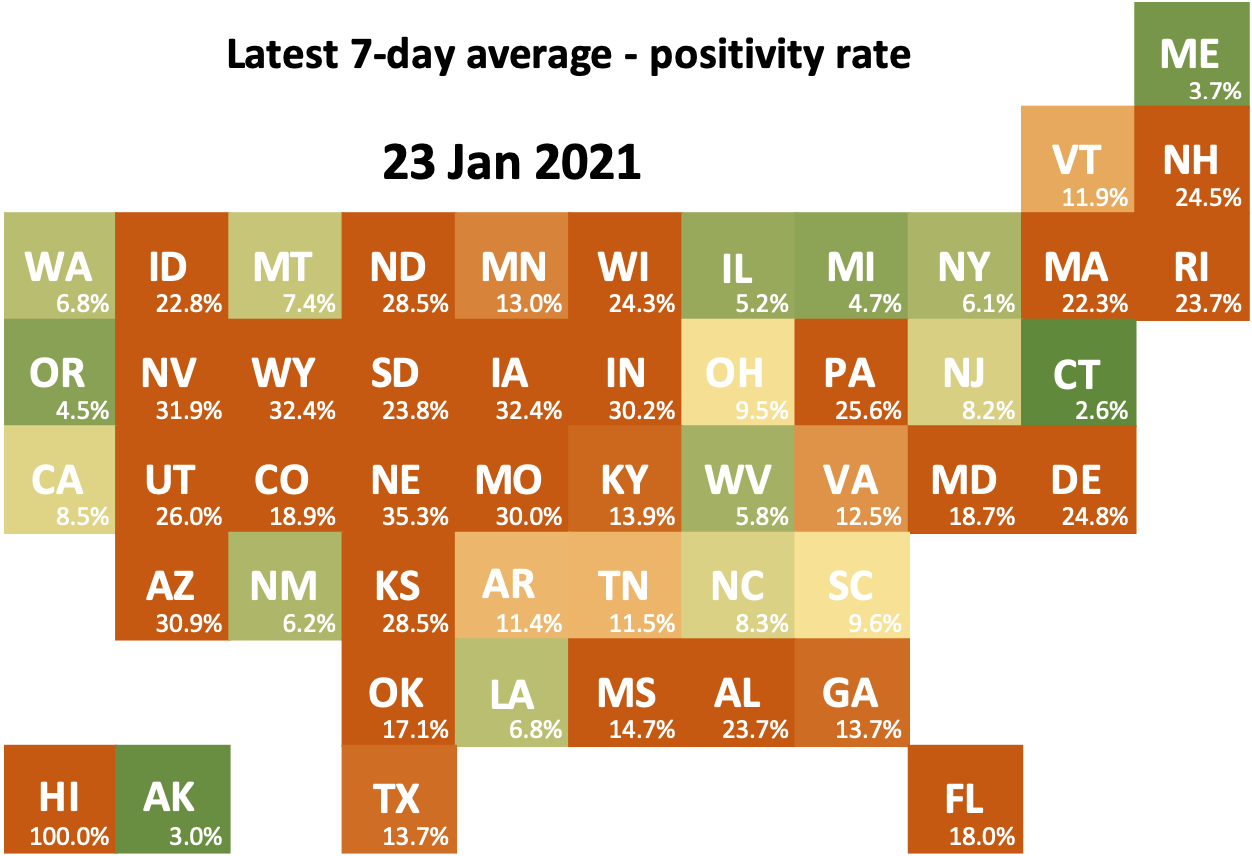
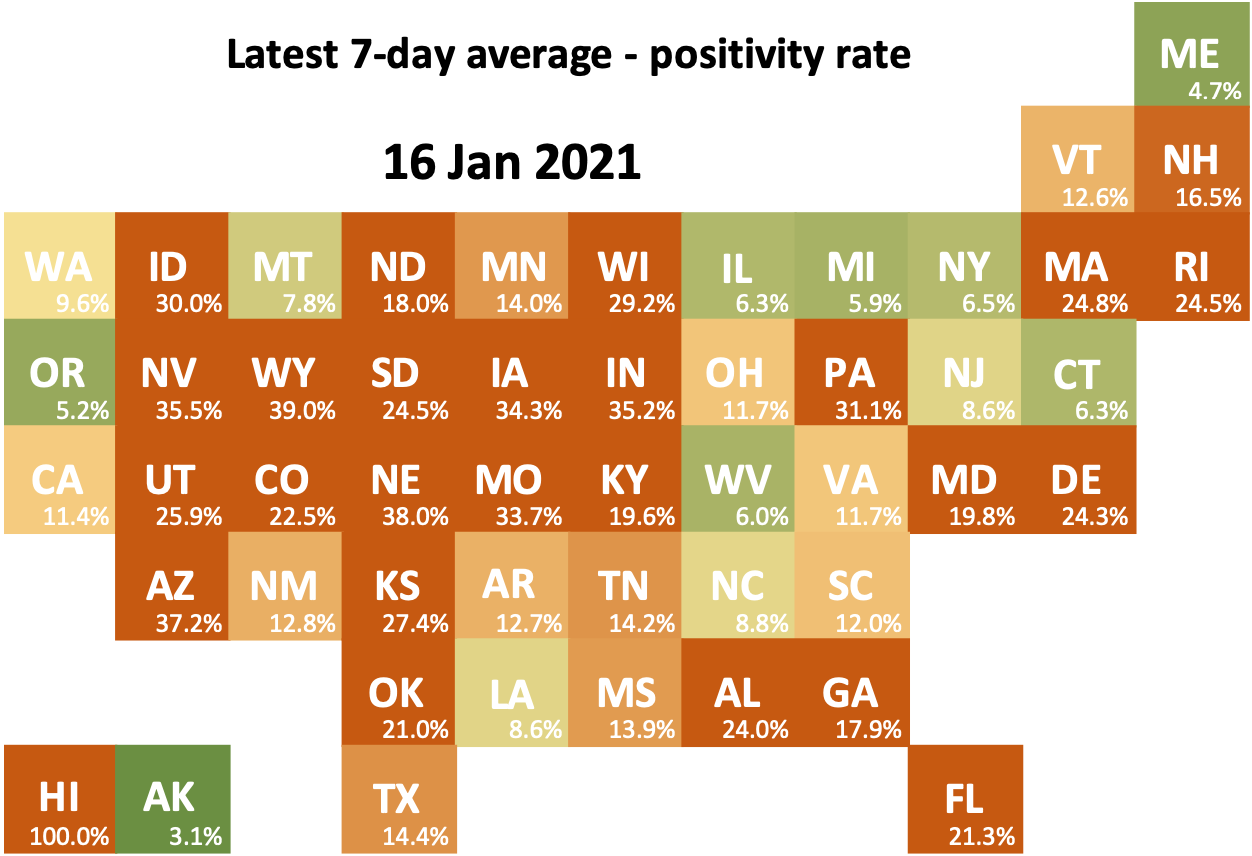
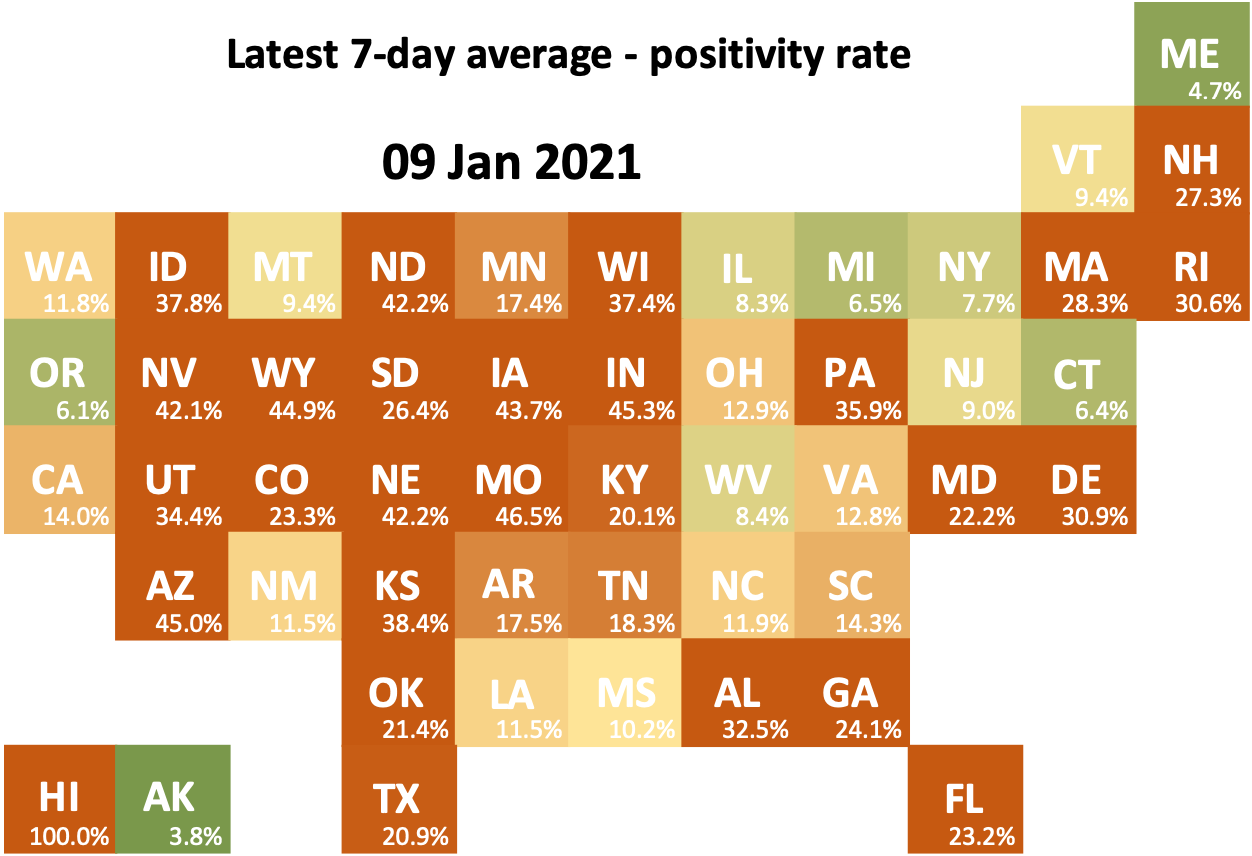
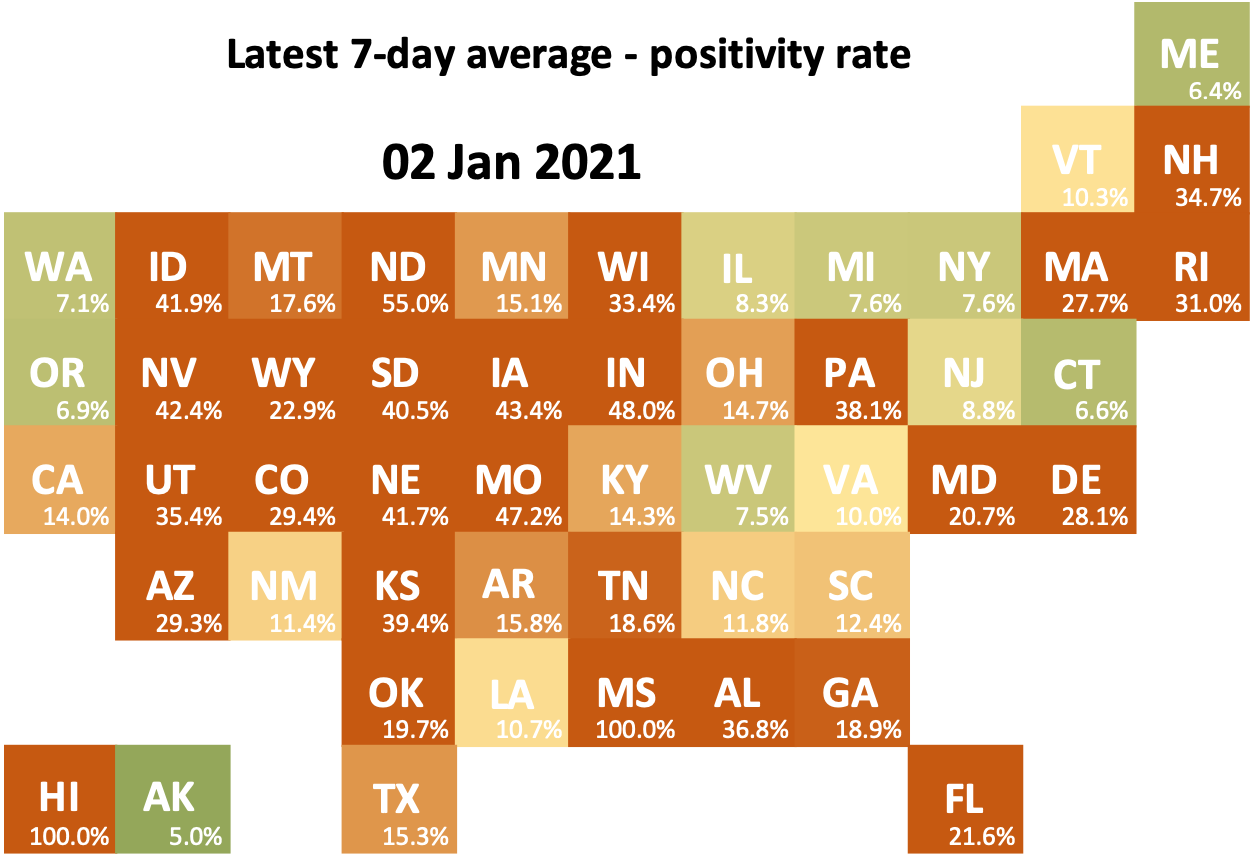
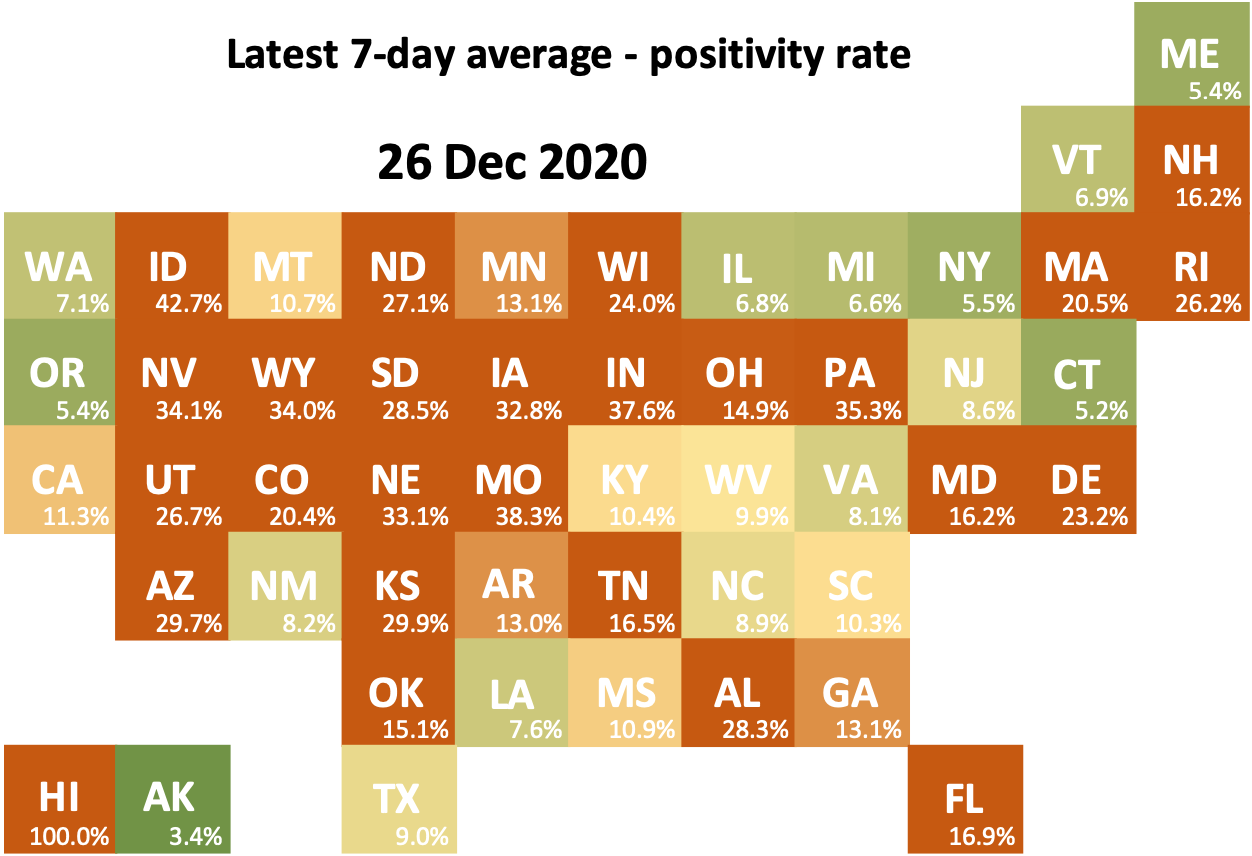
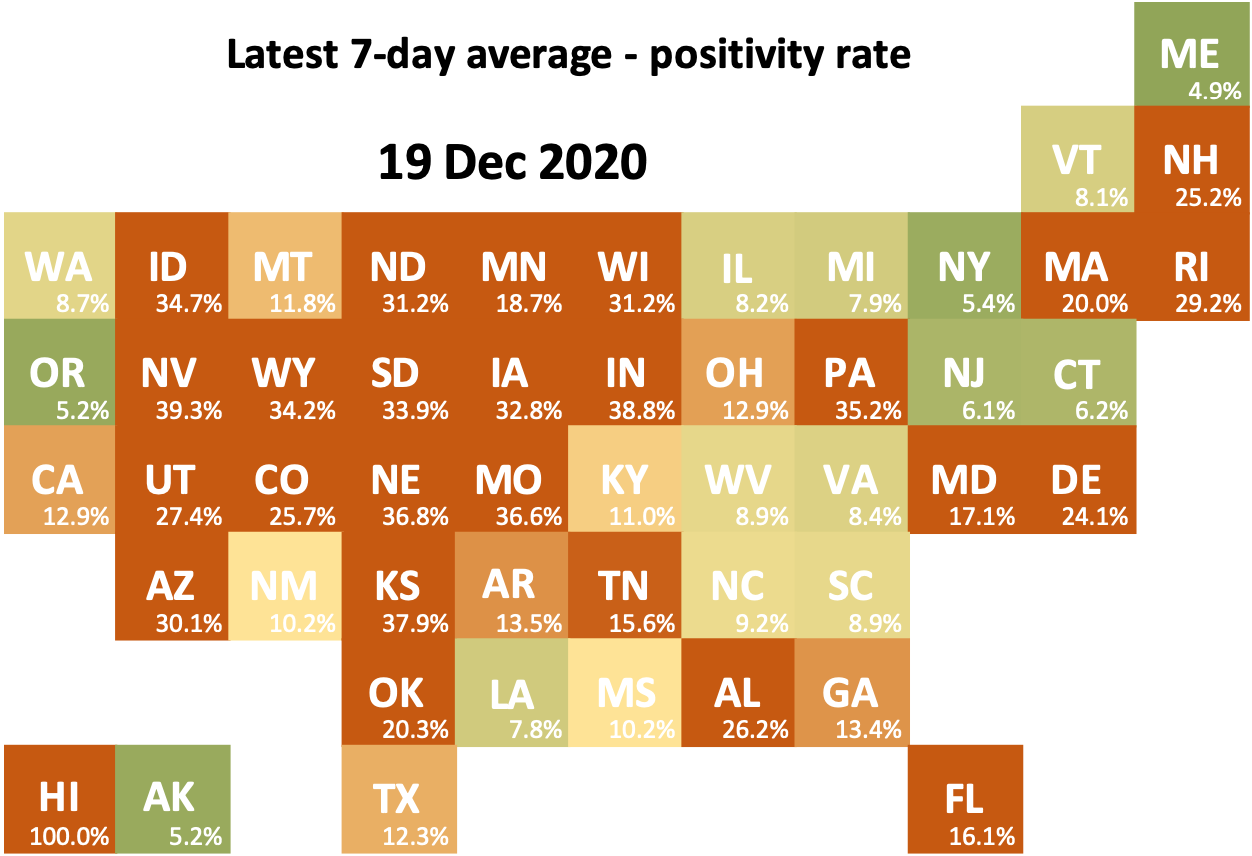

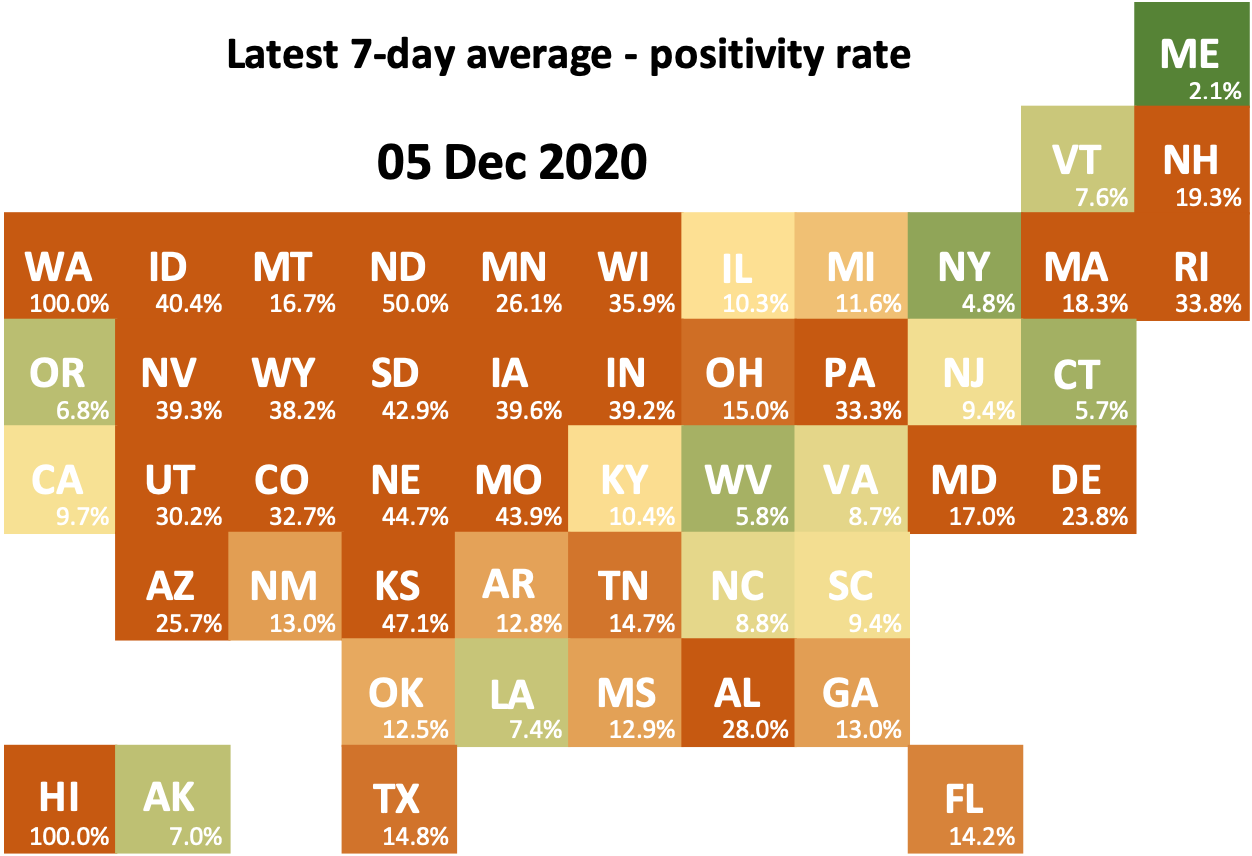
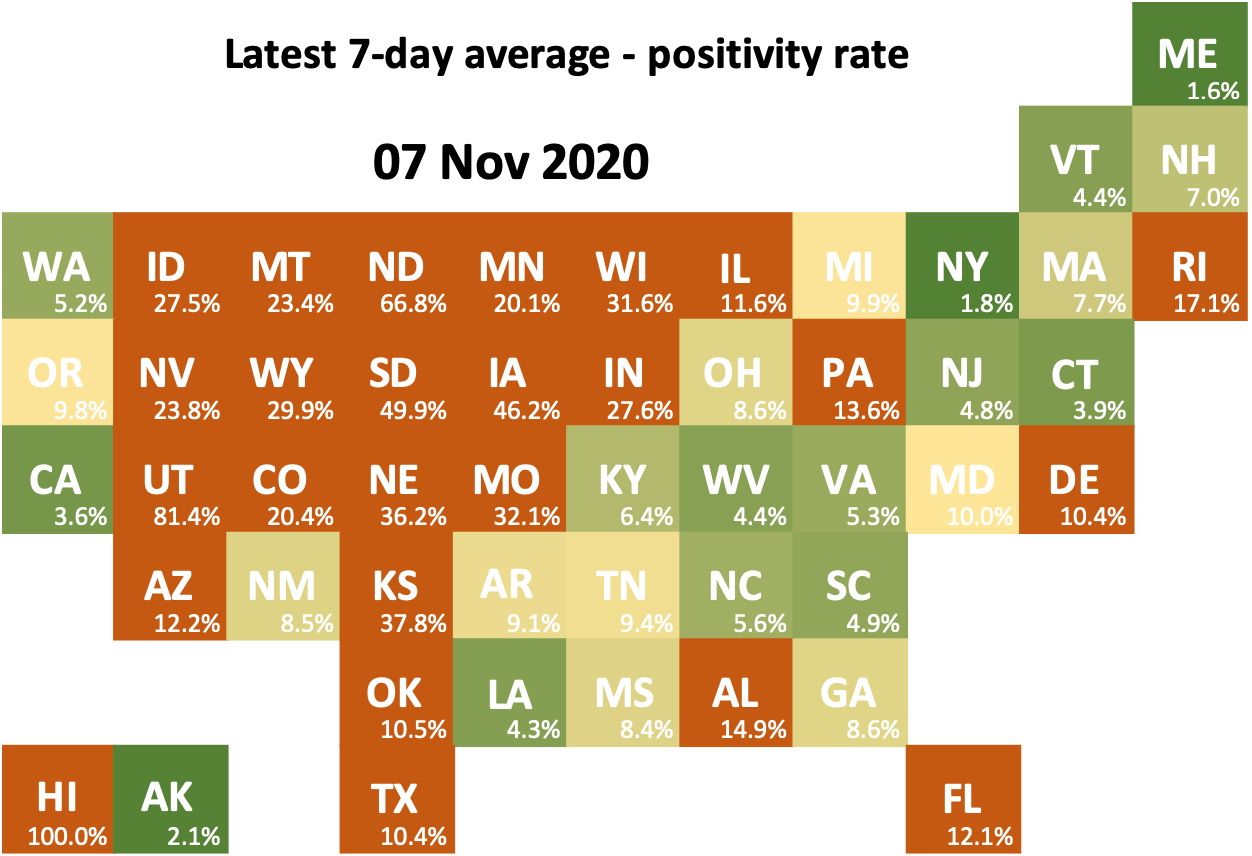
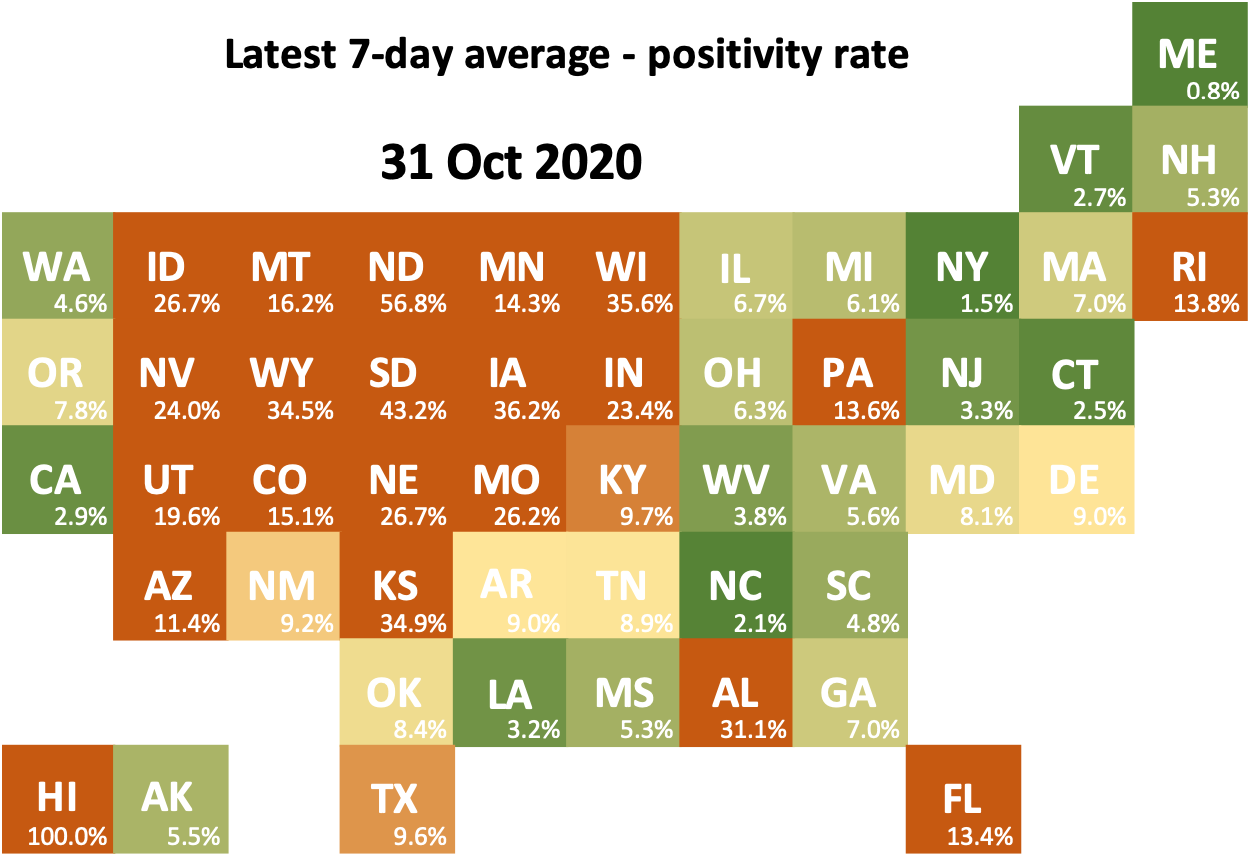
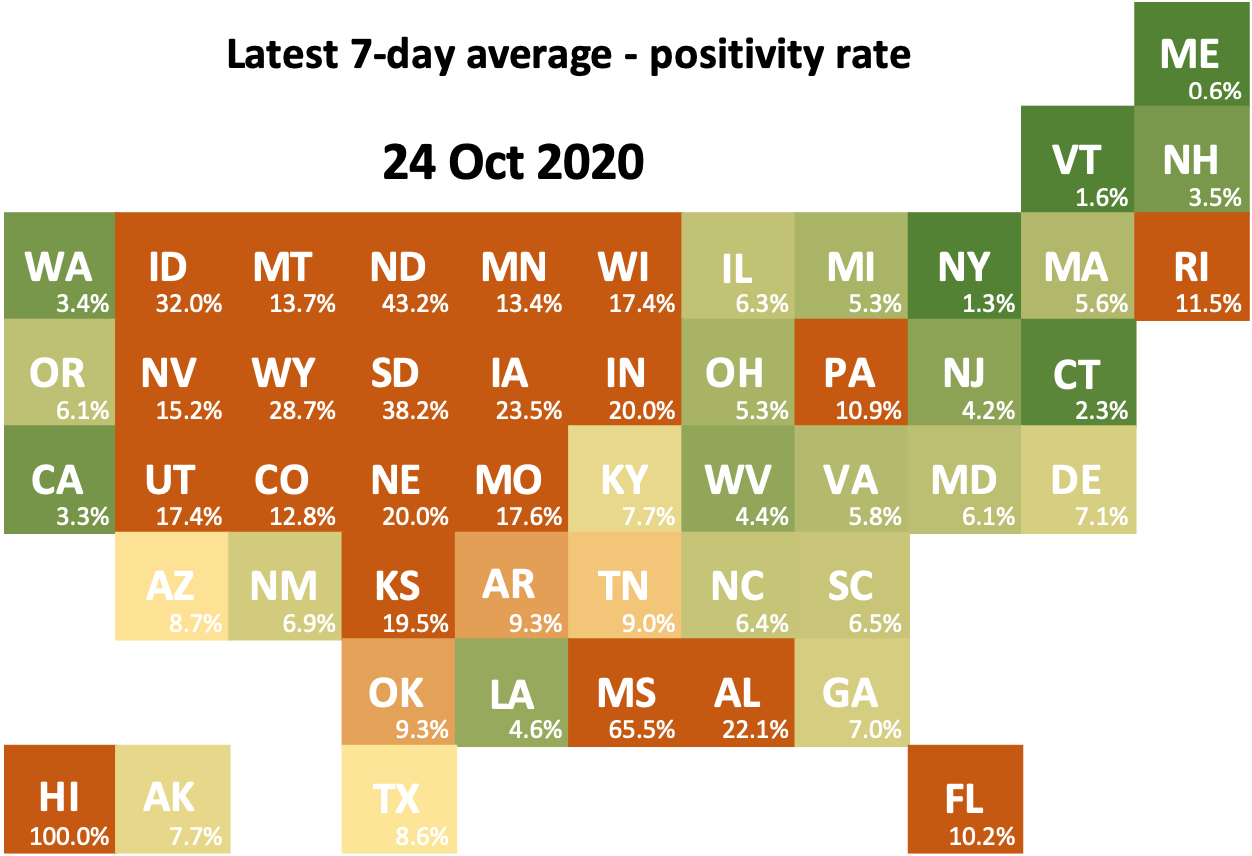

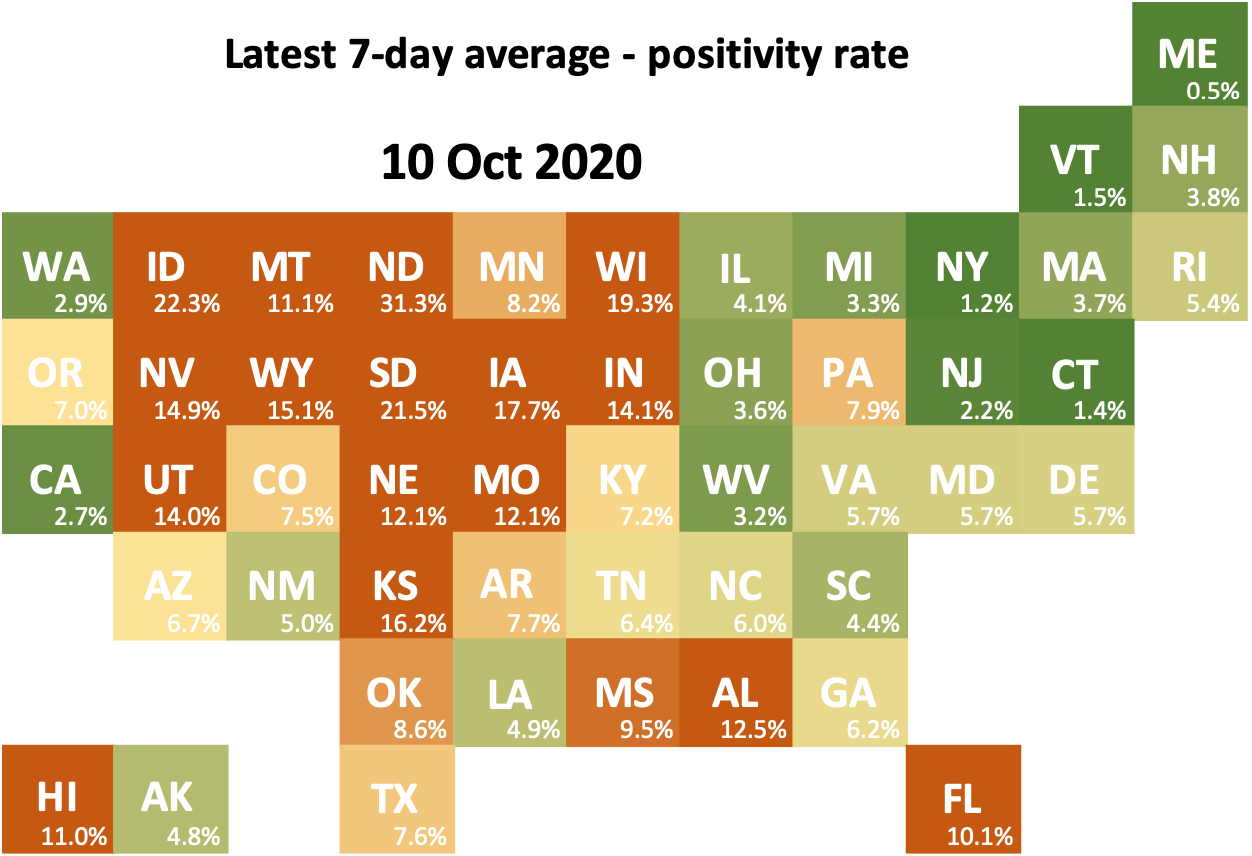
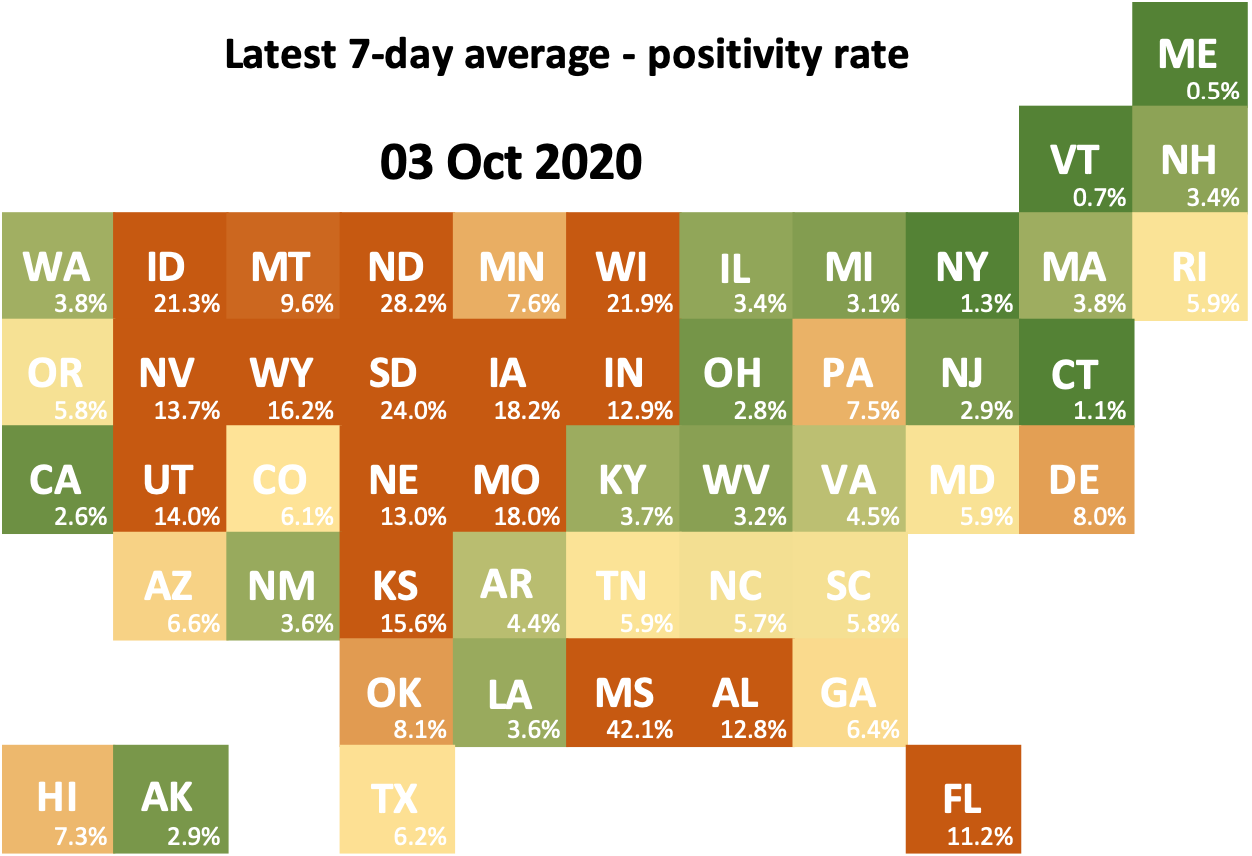
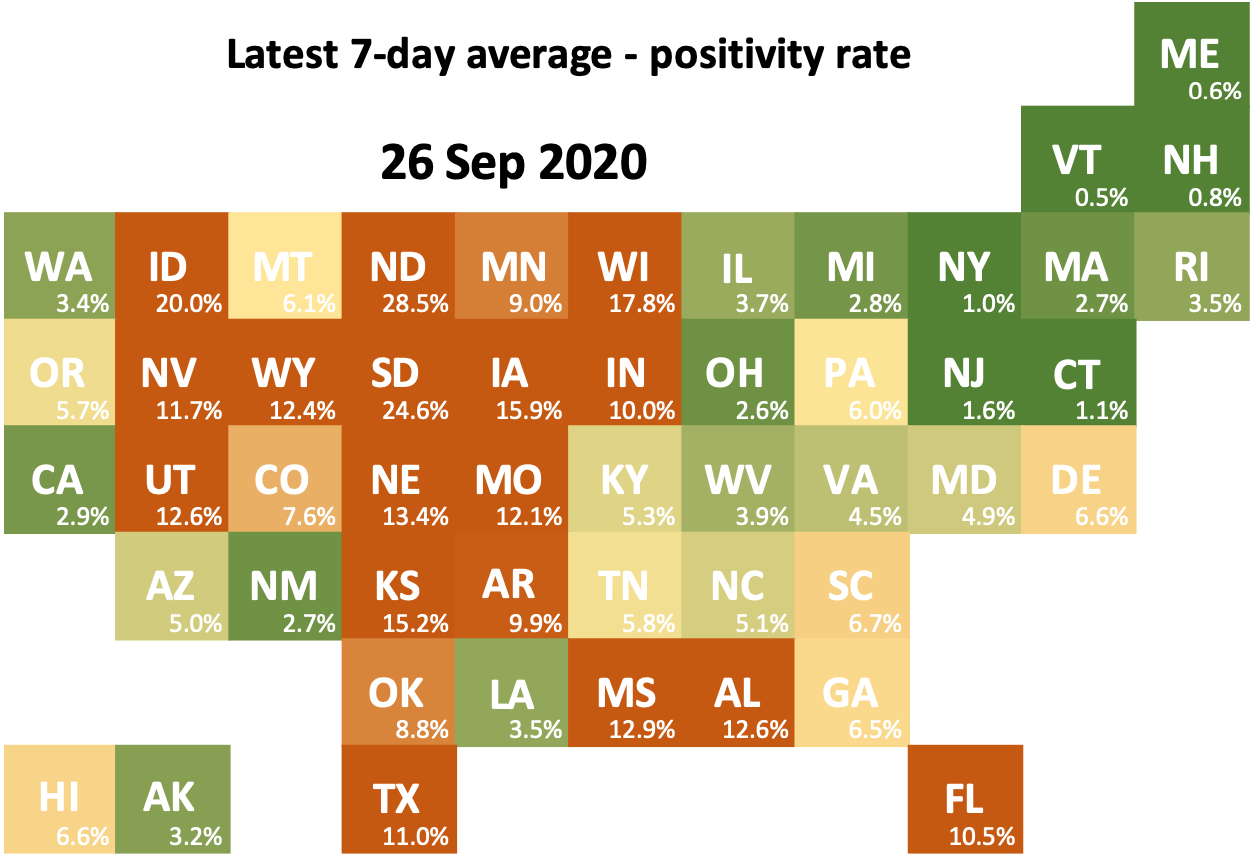
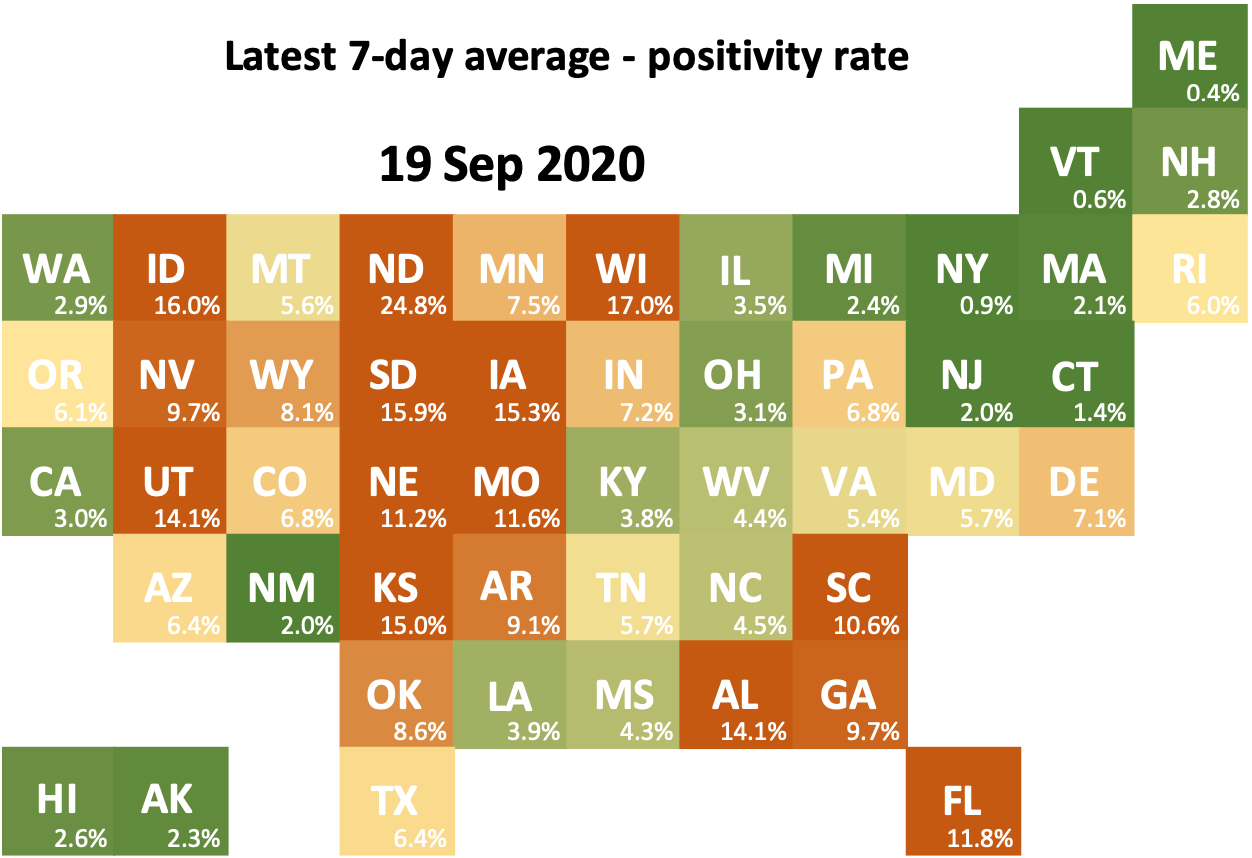
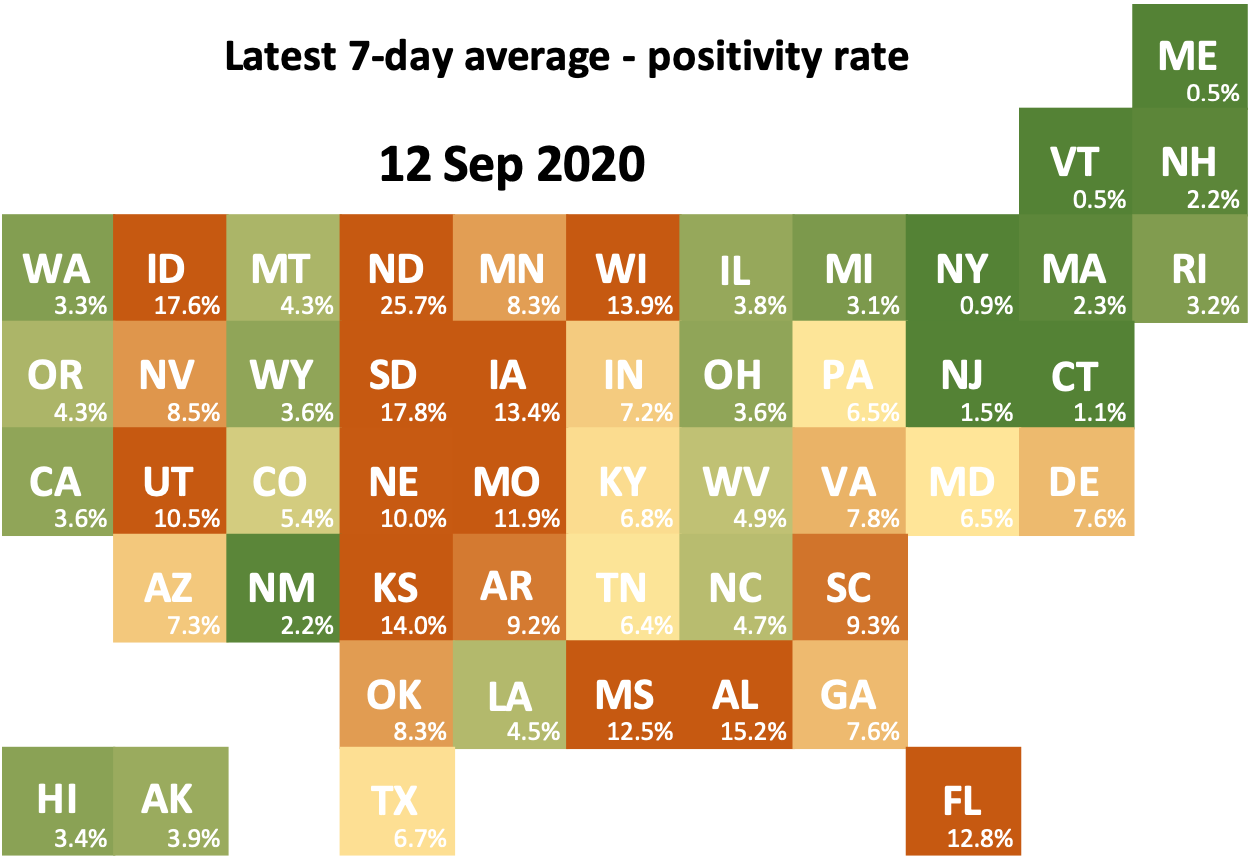
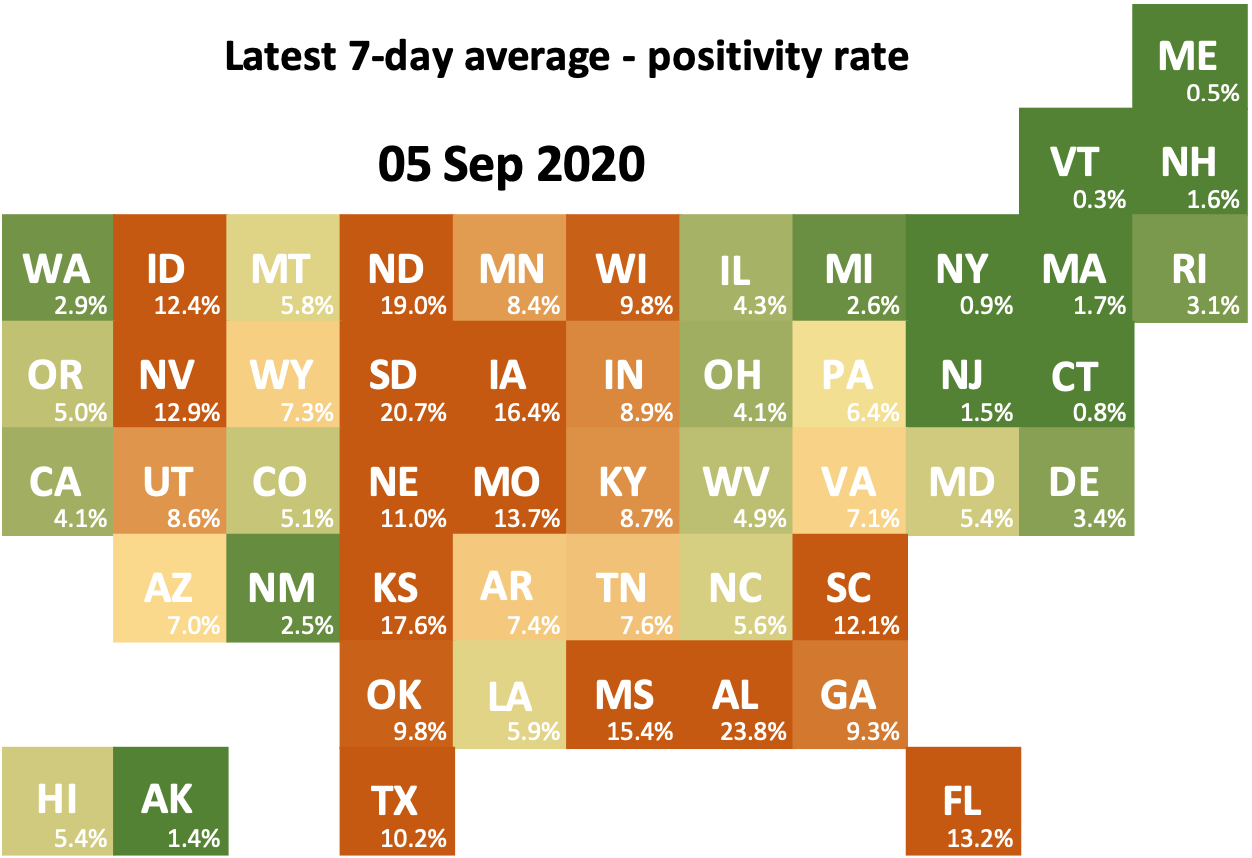

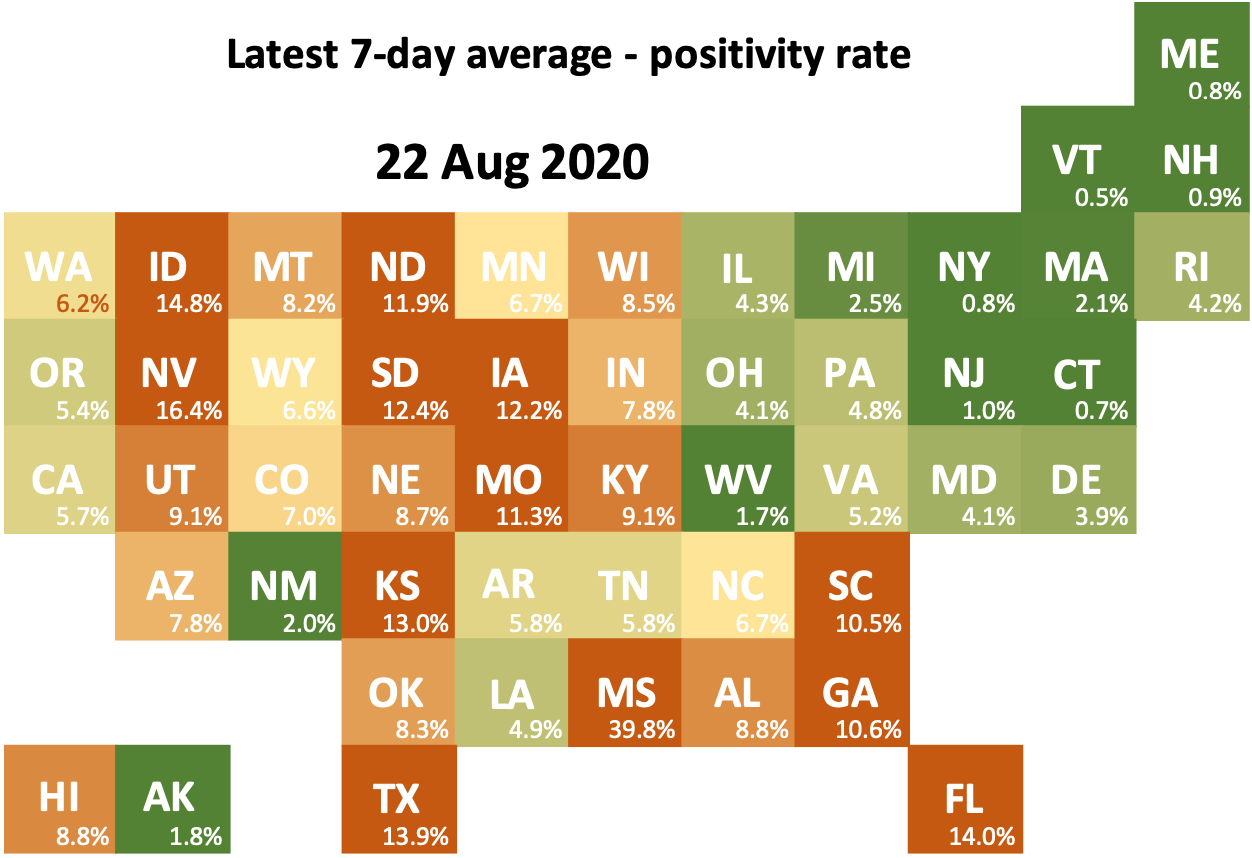
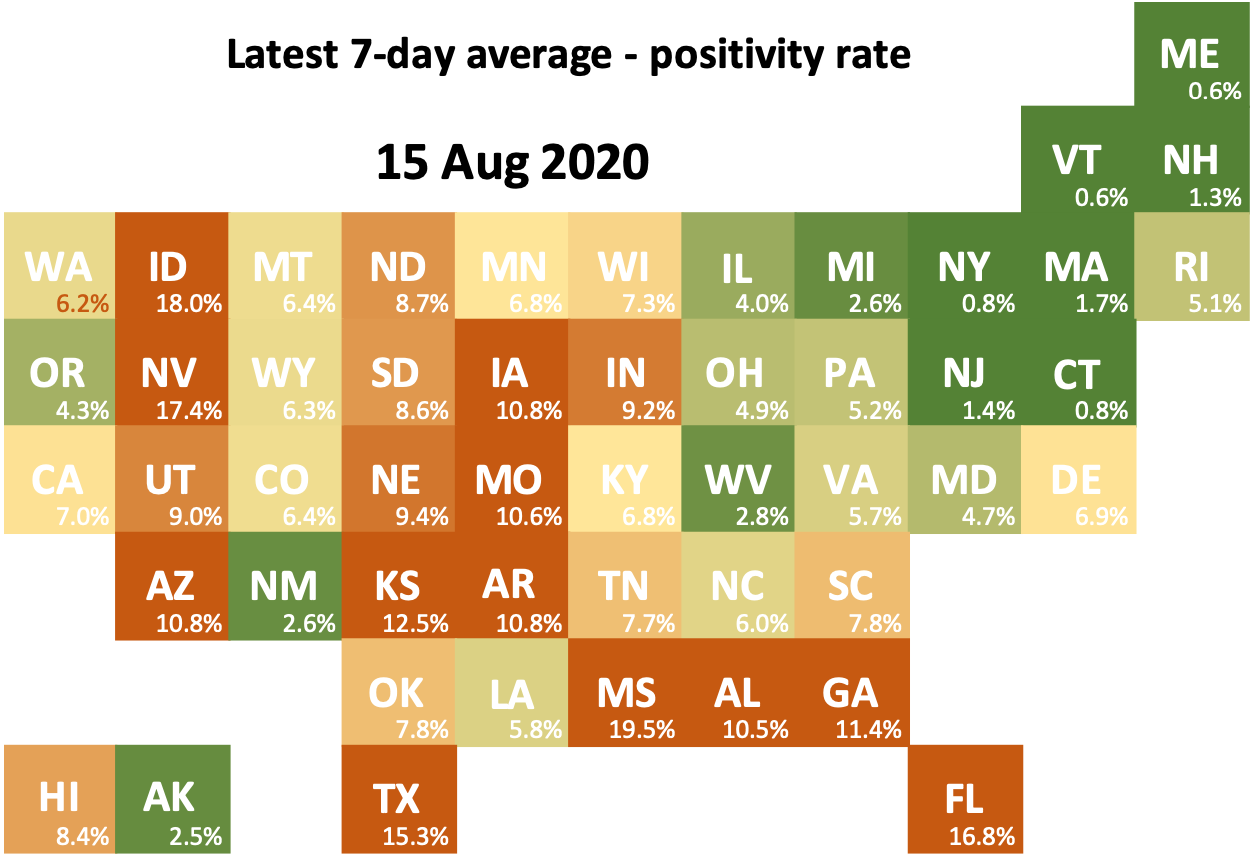
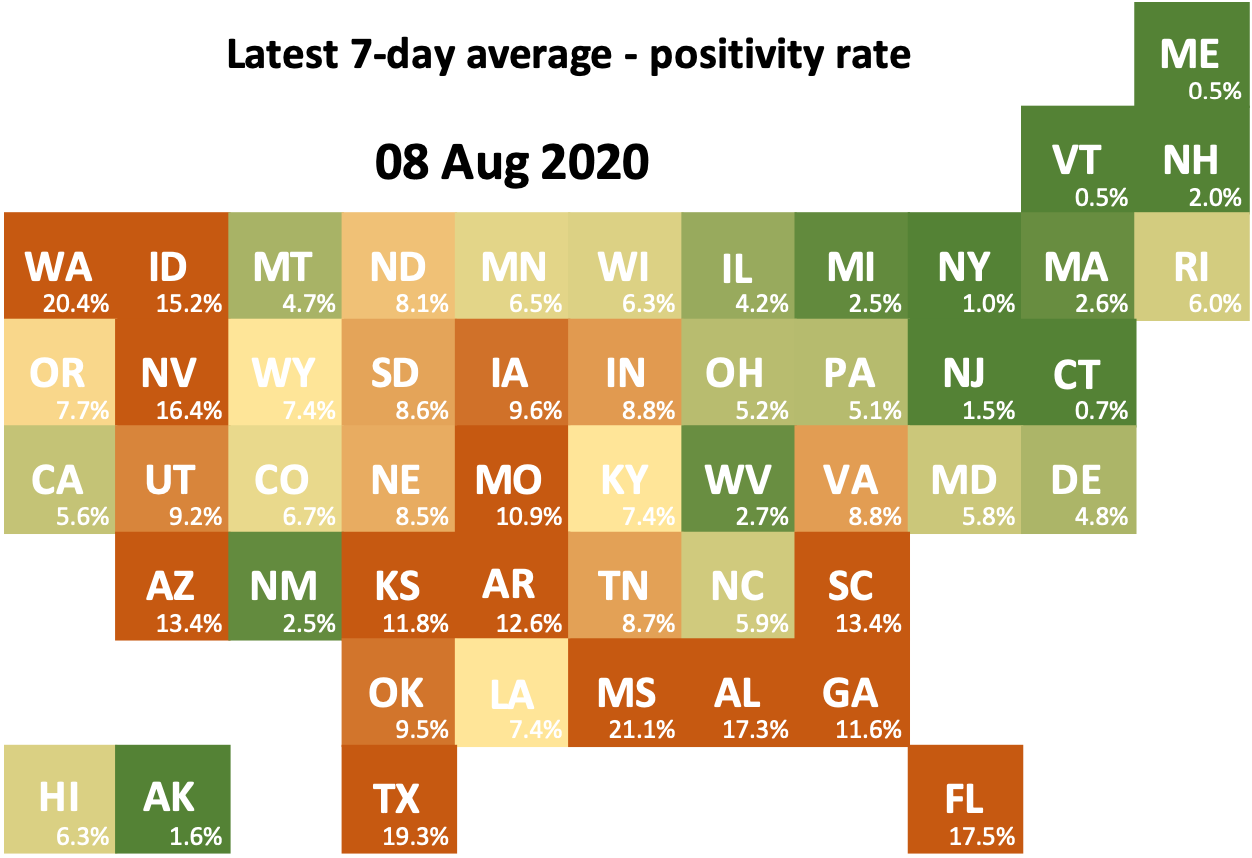
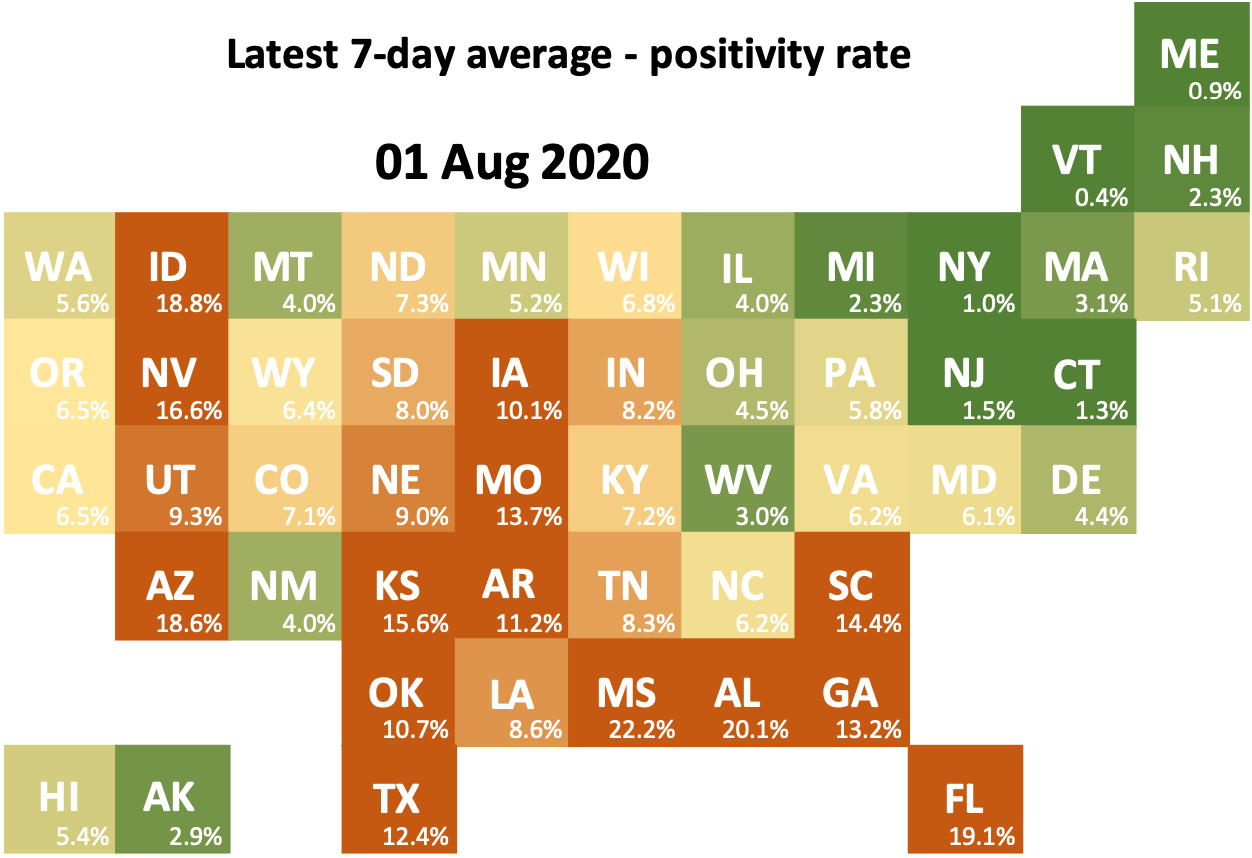
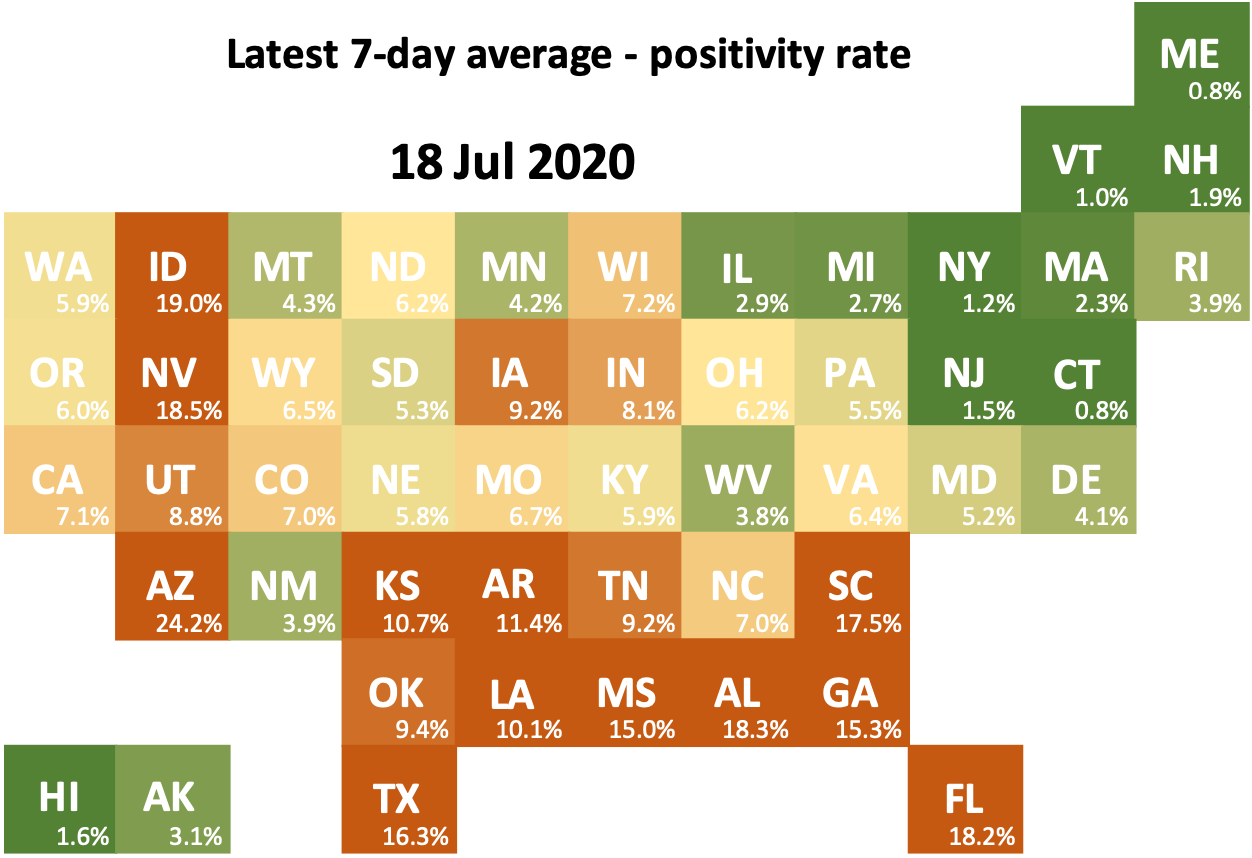
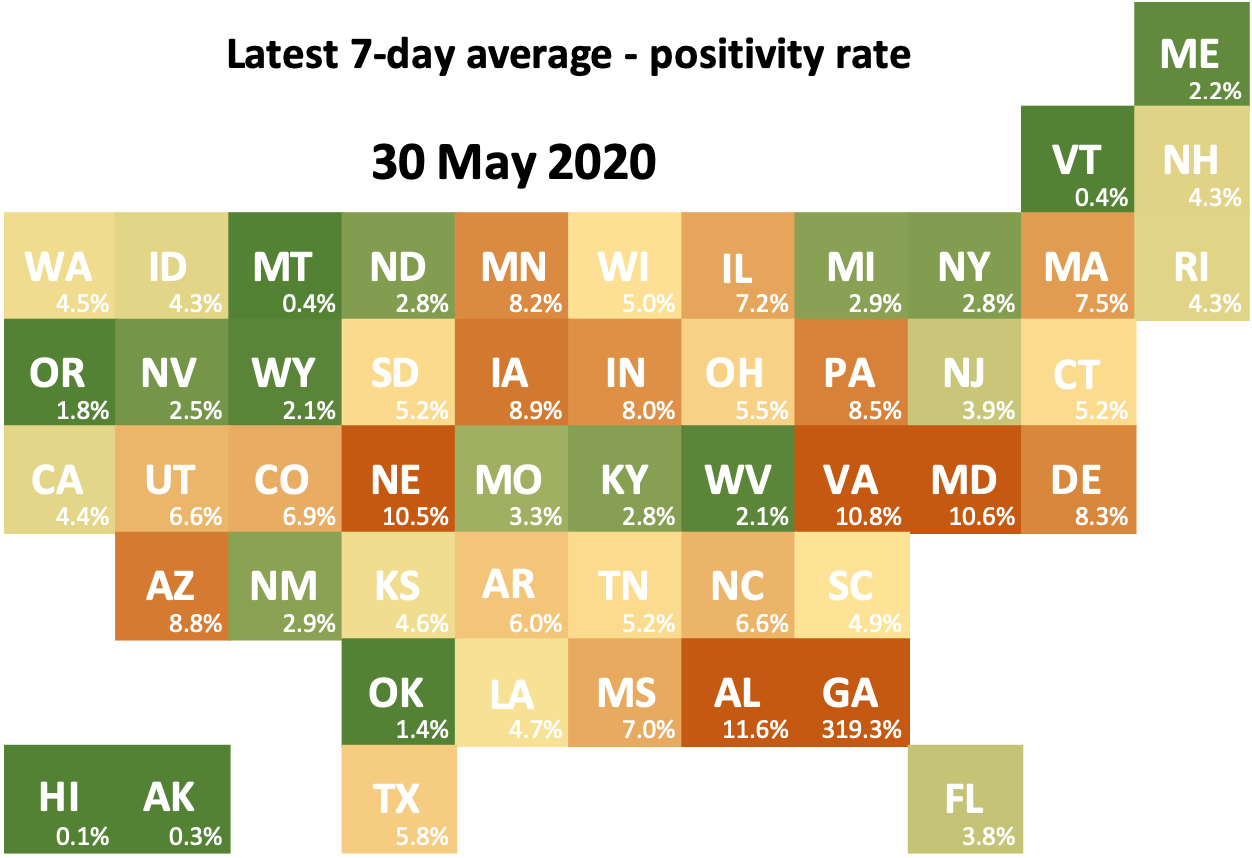
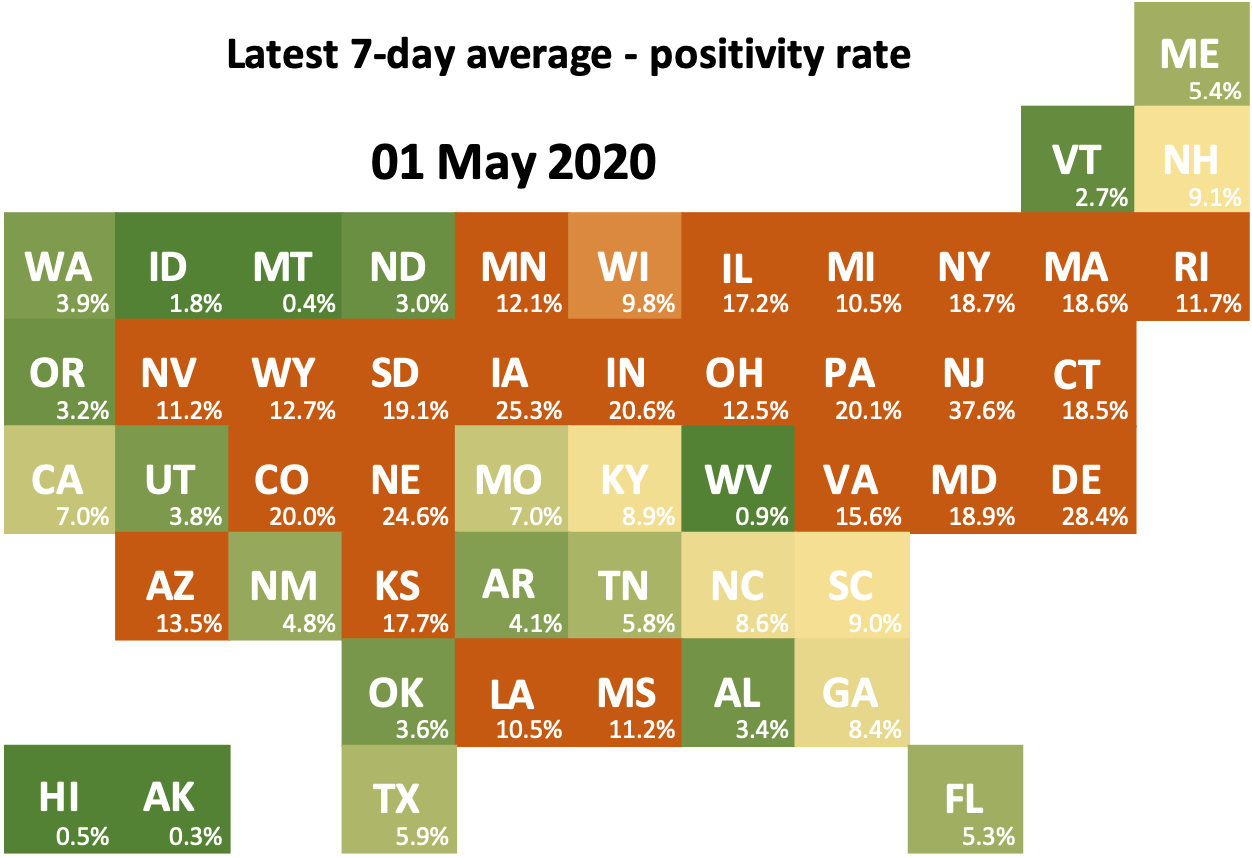
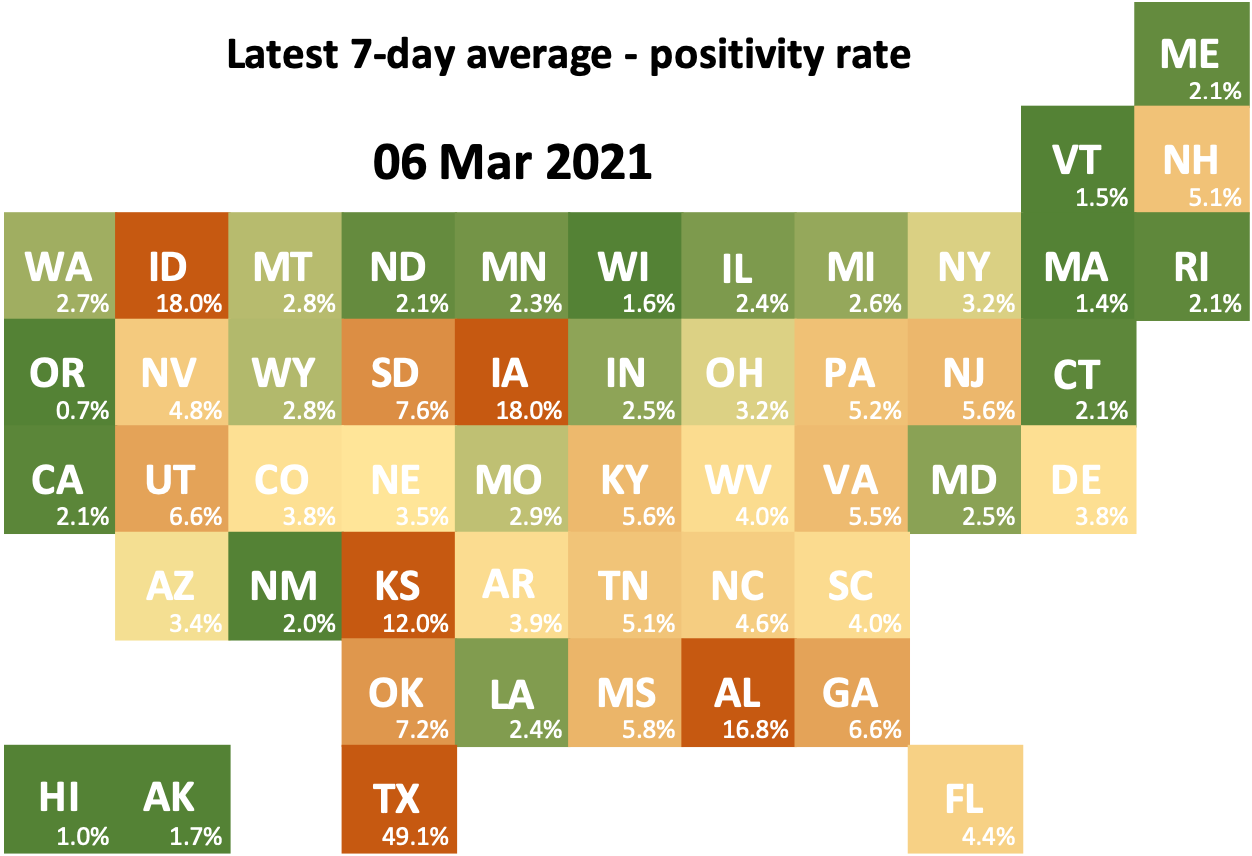
I've been tracking the covid-19 numbers from The COVID Tracking Project at The Atlantic since March 2020. The percentage value for each state represents the 7-day average of percentage of positive tests for that state.
The heat map is based on the 50 values presented: green is lowest (2% and lower), dark orange the highest (10% and higher), yellow/gold represents the median value of the data.
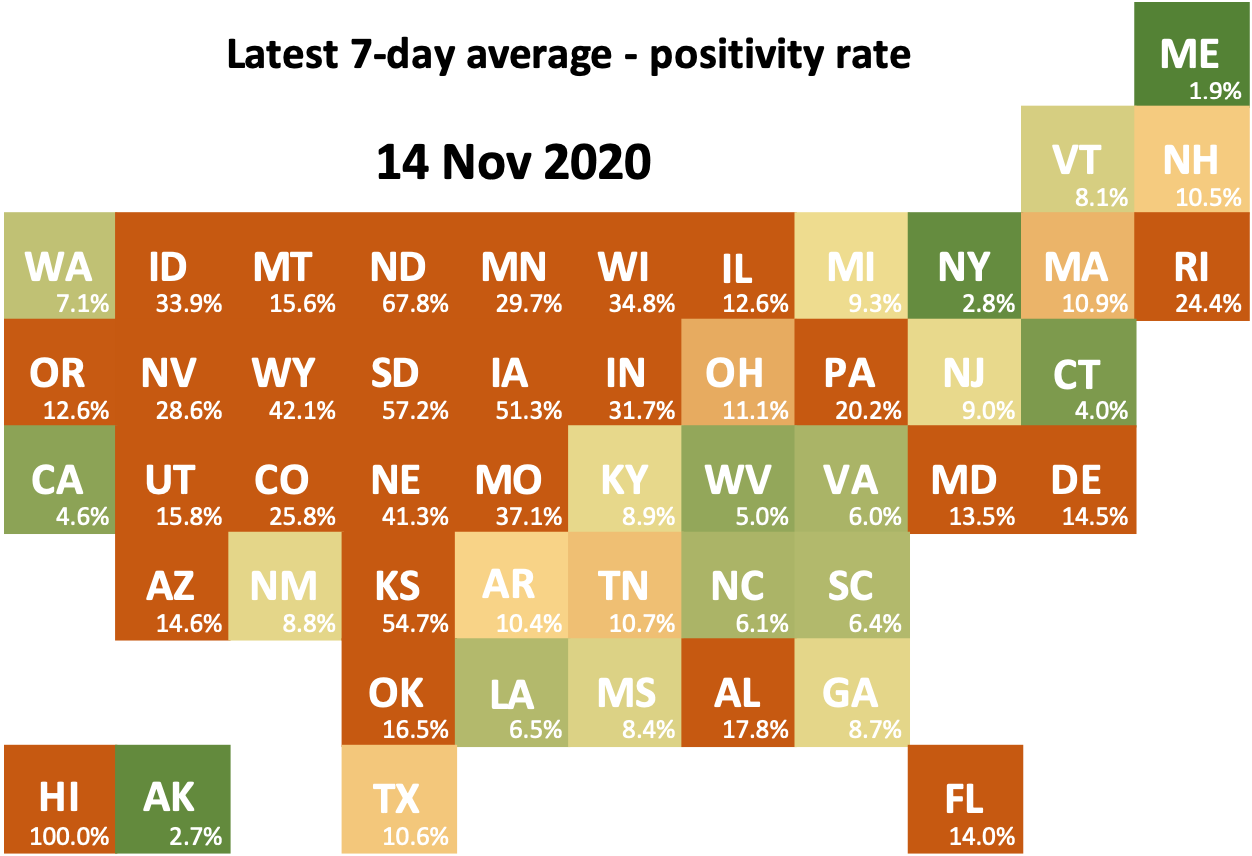
The basis for the positivity calculation shifted between these two weeks - numbers will look lower for most states. There were some shifts in the previous week for specific states (e.g. HI).